
In a previous article I talked about how project management can help reduce PhD students’ anxieties. Most of my PhD I felt very much confused. Sometimes I could not even say whether I was still in the beginning, somewhere in the middle or close to the end of it. Therefore, in that previous post, I suggested that supervisors and students try to define a tangible objective early on in the doctoral process, and to have regular check-point meetings to adjusts plans in order to keep the student’s project on track. I also mentioned that it is highly important to clarify what the supervisors and students long-term expectations are.
In another article I talked about Gantt charts, a great project management tool to draw and visualize a project outline.
Do you see where we’re going here? Let’s draw a timeline of your PhD in the shape of a Gantt chart! I know, it’s in the title 😉
In this other article about Gantt charts, I explained that there are some drawbacks to keep in mind. Indeed, upfront planning techniques like Gantt charts tend to lack flexibility and when things don’t work as planned it can actually increase the feeling of failure, which is exactly what we want to avoid here.
So, does it even make sense to draw a timeline early on in the doctoral process? I believe it does! We can keep the drawbacks of Gantt charts in mind and draw such a timeline if we define guidelines of how to use it.
- Example & download
- Why draw a timeline?
- Guidelines for how to make & use the timeline throughout your PhD
Struggling in your PhD? Would you like some help?
I am offering affordable coaching as part of my credential training!
Check out my new page Coaching for all the info! 🚀
From Spring to Autumn 2026, don’t miss this opportunity! I’m now a professional in doctoral education with over 6 years of supporting for PhD candidates within universities in Switzerland, check out my About page.
1. Example & download:
I draw below an example for the institute where I did my PhD: the Institute of Biology at the University of Fribourg in Switzerland. Therefore, it is designed for a 4-year PhD program with annual committee meetings and for students who spend a lot of time performing lab experiments. However, it can be easily adapted to any field or any doctoral program.
You can download for free the Excel file I used to make this timeline by clicking here.
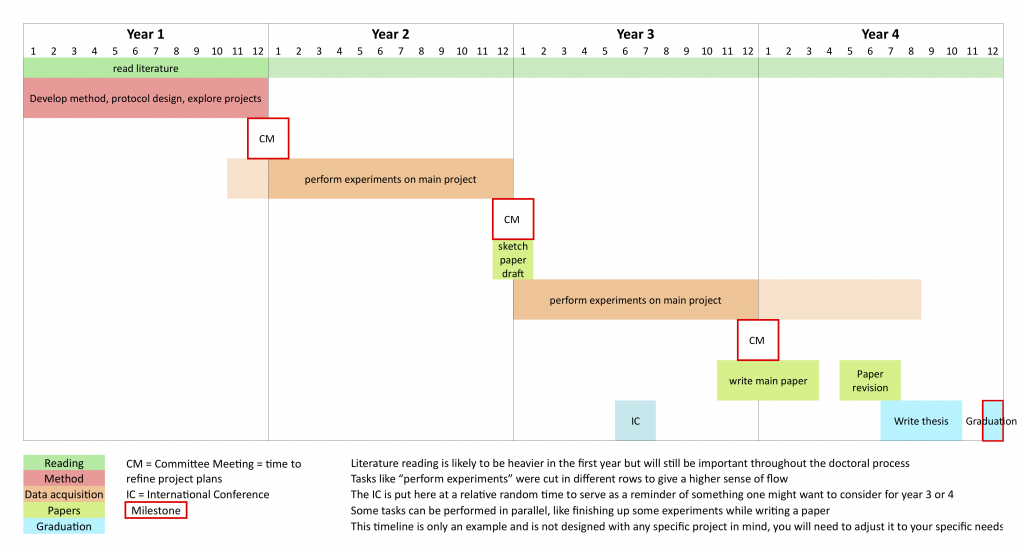
Because I want this to be a general example but also because it is such a long time scale, I kept the level of detail to the minimum to make it flexible and to avoid over-planning. The time for each task here is a very rough estimate, it is meant to be adapted to what you think is best for you or to what is expected in your doctoral program. Importantly, the uncertainty level is increasing with time. You don’t have to start writing a paper on the 11th month of your third year, maybe you’ll start much earlier or much later and it will be perfectly fine. This is just a broad overview to help visualize what the main steps are, but their exact length or when they should start will get clarified once you are closer to it.
2. Why draw a timeline?
To draw such a timeline and for it to be realistic and useful, you are going to ask very concrete questions, to yourself and to your supervisor, like what are the important steps, what are the milestones (technical milestones for developing a protocol, committee meetings, exams…), what are the risks, do you have only one project or do you have more, maybe one large risky project and one smaller safer project, and all other questions which are relevant to you.
Project management is effective if concrete questions are openly discussed. If your supervisor doesn’t bring up these questions with you, it might feel quite scary for you to ask for it. To help you find the courage to so, I believe that having such a timeline will provide you a highly visual and attractive medium to foster these discussions.
When I learned about Gantt charts at the beginning of my second year of PhD studies, I draw myself such a timeline, but I didn’t dare to discuss it with my supervisor. With no surprise things really didn’t work out the way I planned it. Supervisors by default have more experience than a junior PhD student so they should know better what is realistic, what is expected and how much upfront planning can be done depending on the project.
3. Guidelines for how to make & use the timeline throughout your PhD:
- I suggest that you draw a first version within the first two months of your PhD. But it’s never too late to start =)
- Take my example and adjust it, maybe you already have a clearly defined project, maybe not, maybe you don’t need to design a new method, maybe you’ve been included in someone else project with a clear short-term objective, maybe you think you should start drafting a paper earlier, go and adjust it to what feels right to you.
- Make sure to keep in mind that this chart is going to change many times until you graduate, stay flexible. This first timeline should only be an overview of the main steps which you expect in your PhD. It is here to give a direction, and if used regularly it can give a feeling of moving forward.
- Schedule a meeting with your supervisor to discuss this initial timeline (still within the first two months), ask the maximum of questions, clarify the maximum of points and make sure you both agree.
- Then whenever needed, go back to it and adjust it, maybe there is a great collaboration opportunity and for a few months you’ll be asked to put your main project aside and work fully on this collaboration, maybe your new protocol is working great and you’re already getting publishable data, maybe the protocol is not working well and you need to change strategy, how does it affect your timeline?
- Whenever a big change happens or whenever you feel too lost, schedule an extra meeting with your supervisor to specifically discuss the timeline and the long-term objectives. Hopefully it should give you a feeling of being on a track, even if it’s not the first one you pictured.
- I would suggest having such a discussion at least every 6 months.
This timeline is now a tool which is going to grow with you throughout your PhD. At first it is a rough overview of the main steps, if you keep it update with what you really do, at the end it will be a true overview of everything you’ve accomplished. Therefore, on top of guiding you through it, it will become a great tool to look back at your PhD experience once you’re finished.
Thanks for reading and I hope these ideas can help you 🙂
Make sure to read my previous article about Gantt charts where I explained that it can be used both for long-time scale like here, or on shorter time scale (like 2 months) with a higher level of detail.
Looking for more reading about project management for research? Have a look at the resource I made Project Management resource for PhD students and supervisors!
If you subscribe to the newsletter you’ll get my articles in full text directly in your inbox 🙂


0 Comments