
In a project management for researcher workshop which I attended at the beginning of my second year of PhD studies, we were taught how to make Gantt charts.
To give a short answer to the question I asked, “are Gantt charts useful for PhD students?”, I’d like to say: yes and no.
Yes—it can be, but there are some drawbacks which one should know about before naïvely thinking (like I did) that it was the most brilliant thing ever and that I was really going to plan out my full PhD with it.
Actually, after the workshop I never took the time to work more and adjust my original Gantt chart. From time to time I was looking back at it and getting the “haha, nothing is working as planned” feeling…
So, before we go on, let’s explain what a Gantt chart is:
“A Gantt chart, commonly used in project management, is one of the most popular and useful ways of showing activities (tasks or events) displayed against time. On the left of the chart is a list of the activities and along the top is a suitable time scale. Each activity is represented by a bar; the position and length of the bar reflect the start date, duration and end date of the activity. This allows you to see at a glance:
- What the various activities are
- When each activity begins and ends
- How long each activity is scheduled to last
- Where activities overlap with other activities, and by how much
- The start and end date of the whole project”
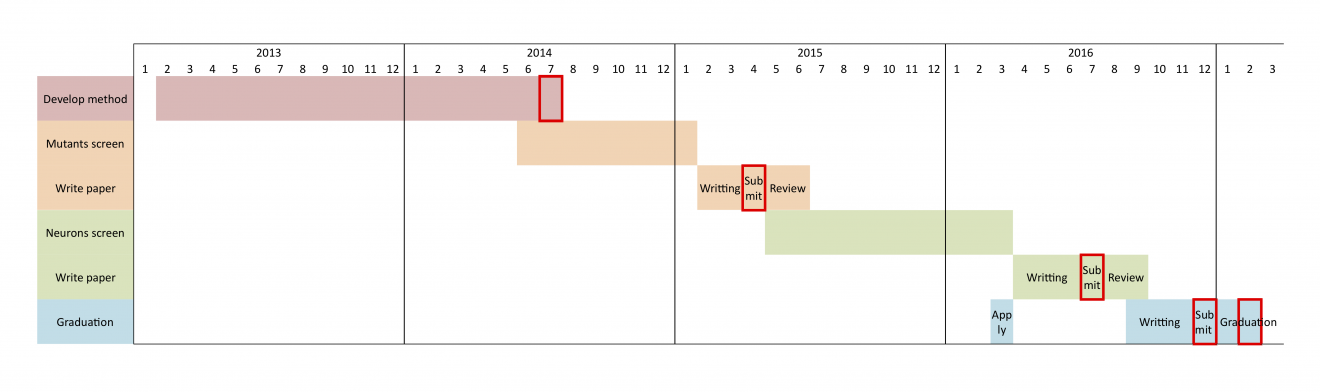
and it looks like this (taking my own simplified Gantt chart as an example)
How to make a Gantt chart concretely?
First, it needs a list of all the project’s main tasks, and to estimate for each one how long it will take. Then clarify the dependency between tasks, i.e. when task 1 has to be finished before task 2 can start, but tasks 3 and 4 can be carried in parallel. Identify milestones such as: task 1 is to develop a robust protocol and this protocol needs to be fully validated with my committee before starting experiment x.
Then to actually draw the chart, you could look for a software specialized for that, there are many and they are likely to make things more complex than you need. Or you could do it in Excel like I did for the example above, or even start on paper 🙂
What are the advantages?
It’s a highly visual tool. Like you see in the example above, in one chart we can draw the main steps of a whole PhD, from day one all the way to the defense. In particular, it nicely displays the dependency between tasks.
Like mentioned, it helps define technical milestones, like validating the methodology, and it can also be used to schedule and visualize other important milestones such as committee meetings. This might sound scary for a student who’s already feeling overwhelmed by academia, but I do think that actually visualizing these milestones helps demystify them and getting ready for them. What do you do to feel ready for a talk? You prepare for it, you plan for it.
One maybe unexpected pro of Gantt charts is that it helps to plan for weekends and holidays. For example, in biology, if you work with living samples you may not be able to perform experiments the week after you came back from holidays. Putting all this on paper in such a visual way will definitely help plan experiments and stay more realistic. One may also find it useful to show to a pushy supervisor who tends to forget how long experiments take…
Another good thing to know is that Gantt charts are well perceived in grant applications or any kind of project proposals as it allows to draw a project layout, especially if one includes possible alternative scenarios. Thus, learning to create such charts early can only be a good thing.
What are the drawbacks?
Over-planning and lack of flexibility.
If you take a long-time scale, like 4 years of PhD studies, you should be really careful not to detail too much, don’t over-plan. Because as we know, academic research is highly unpredictable and things are unlikely to work as planned.
If one invest a lot of time and energy in creating a detailed Gantt chart, then one is not gonna be willing to adjust this chart when things didn’t work out as planned. Therefore, on such a long time scale, I would suggest not to include any task which is shorter than 3 months, and to keep in mind that it is going to change many times until the PhD defense. Committee meetings or any other important meetings are great opportunities to re-discuss plans and adjust such PhD’s Gantt chart.
Especially if you’re still early in your PhD studies or if your project(s) relies on many uncertainties. Don’t put in your Gantt chart, like I did, “one year from now I will start writing a paper about project x”, because, in the meantime, we prioritized another more promising project. But because I wrote it in my Gantt chart and I never got to complete this task, it still feels like a failure. Obviously “scheduling” such a task while being in the early phase of a new project and without discussing it with my supervisor was not a very smart thing to do. A more useful thing to put in my Gantt chart would have been, “start sketching a paper draft”, not saying on which subject, or simply “take time to seriously evaluate the situation and re-discuss priorities.”
However, if one takes a short period, like 2 months, and a clear objective, then a detailed Gantt chart can be really helpful. When does such a situation happen? For example, for paper revisions, for the final months of your thesis, or any situation with a clearly define deadline, a short-term goal. What is the objective and what needs to be done to reach it? Write everything down, clarify and estimate. Then take your calendar and draw on paper: if I start this experiment that day, then I’ll get the result by …; I can start this thing in parallel, but only when this first thing will be done then I can start this other thing … oh and there is this important meeting here, so I won’t be able to do x that week; oh and there is this 3 day weekend we scheduled with my family meaning I will need to ask my colleague A (for awesome) to take care of my Drosophila … etc. Got it? 🙂
But you still need to be careful there as well, stay realistic, don’t plan more than 60% or 80% of your time, clarify what you need to have versus the nice to have, and always stay open to adjust plans as time goes. Importantly: schedule time to slow down, to analyze results, to re-discuss things with your supervisor, to make sure you’re still on track, and to adjust the Gantt chart.
In conclusion: Are Gantt charts useful for PhD students? Yes, it’s a great project management tool to learn, and if used properly it can give both a sense of where one is on the whole PhD process, and a sense of how everything which needs to be done in the coming weeks is going to fit together.
Hope it helps you and thanks for reading! 🙂 I now published a follow-up article of this one with more details on how to create a timeline of your PhD with a Gantt chart. In this article you can even download for free my Excel file to get you started with Gantt charts!
Subscribe below to get the next articles in full text directly in your inbox!


0 Comments